Cost Behavior and Cost-Volume-Profit AnalysisWarren / Reeve / DuchacExercise 19-2 solution |
The following cost graphs illustrate various types of cost behavior:
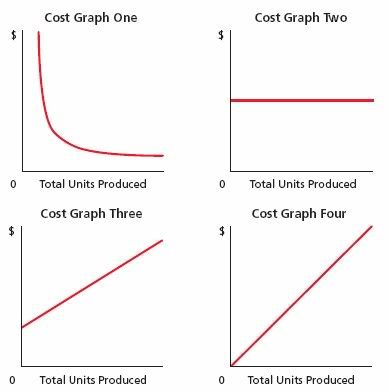
For each of the following costs, identify the cost graph that best illustrates its cost behavior as the number of units produced increases.
a. Total direct materials cost: Graph Four
b. Electricity costs of $2,000 per month plus $0.09 per kilowatt-hour: Graph Three
c. Per-unit direct labor cost: Graph Two
d. Salary of quality control supervisor, $10,000 per month: Graph Two
e. Per-unit cost of straight-line depreciation on factory equipment: Graph One